Laffer Curve
An economic theory examining the relationship between tax rates and the amount of tax revenue the government receives


What is the Laffer Curve?
The Laffer curve is an economic theory examining the relationship between tax rates and the amount of tax revenue the government receives. Specifically, this theory is used to model that, in some instances, lowering the tax rate can increase tax revenue.
Intuitively, one would think that a higher tax rate would lead to more tax revenue for the government, and in many cases, this is true.
The curve contends that there is a point of diminishing returns when raising the tax rate, similar to what is seen in other areas of economic study.
Laffer's theory is based on the premise that, at a certain point, individuals will become discouraged from engaging in taxable events such as working or investing. If this were to happen enough across a country, an increase in tax rates could lead the government to bring in less money.
This principle of diminishing marginal returns or marginal utility is essential for this topic across economics.
These two principles state that when engaging in an event, say, buying an ice cream cone on a hot summer day, the value to the consumer of each ice cream cone falls as they believe more.
The first ice cream cone is of much higher value than the second, third, fourth, etc. This same idea can be applied to taxable events such as working or investing. The importance of putting in those extra few hours decreases when taxes are higher.
Similarly, investing in stocks or mutual funds loses some of its utility if the gains are taxed at a higher rate. This scenario regarding taxable events playing out across the country is what the curve is predicated on.
Workings of the Laffer Curve
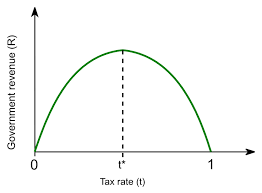
The curve then shows optimal taxation at some point, where tax revenue is the highest. Where that point is, though, can vary from country to country and over time.
Higher taxes hinder the incentive to have more profits, work more, and produce more at a certain point. This premise would then lead to two outcomes:
- Less tax revenue due to a decrease in taxable activities
- Hindered economic growth caused by individuals adjusting their behavior as they are not rewarded enough for their labor and investment
Many things drive economic growth, but one of the most significant contributors is an investment. Investment can only be made rationally with excess money (profits). If the government takes more profits, there is less money available for investment in future growth.
This is illustrated by the curve itself quite simply. At a 0% tax rate, there are zero dollars in tax revenue, and the same at a 100% tax rate, as no person would be incentivized to work if the government took 100% of their paycheck.
More labor and higher production and investment levels increase the pool of money that the government can tax. Thus, discouraging these events with higher taxes would lead to a smaller collection of funds to tax and less tax revenue.
He also believed that businesses are more likely to spend resources to avoid taxation or even move operations overseas to maintain their bottom lines than to accept the higher tax rates.
As with most products, services, and anything to do with an exchange of currency, the curve states there is an equilibrium point for taxation. Just as you would spend $3/gallon on gas and consume at an average level, at $6/gallon, you start making fewer trips to the pump if possible.
However, the curve does not explicitly specify what this point should be. Moreover, with an ever-changing macroeconomic landscape, it would be foolish to pinpoint an exact figure to be applied at all times.
The curve allows for variation based on a multitude of factors that could be at play. For instance, whether the country is in recessionary or expansionary periods.
History of the Laffer Curve
The Laffer curve theory comes from Arthur Laffer, an American economist who notably served as an economic adviser to the Reagen administration. Years before being put into fiscal policy, the curve was once just a sketch on a napkin done for illustrative purposes.
In 1974, the Ford administration was considering raising the tax rate to increase tax revenue for the government. This was widely accepted as accurate; raising the tax rate = more tax revenue. However, Laffer believed this to be a fallacy.
He sketched out a model of his theory and presented it to senior staff members of the Ford administration. While not used to implement tax cuts until a few years later, the counterintuitive concept began to materialize with legislatures.
Laffer is an economist who studied the subject at Yale University for his undergraduate degree before receiving his MBA from Yale and then his Ph.D. in economics from Stanford University.
He continued to work in economics as a professor at the University of Chicago, known for its classical economists, before moving into various government advisory roles. Most notably for his work for the Reagen administration and consulting work for the treasury secretary.
Laffer Curve Application
The curve finally got its chance to prove itself in the 1980s during the Reagen administration. Laffer was one of the top economic advisors to President Ronald Reagan. In 1981, the Reagan tax cuts were made via the Economic Recovery Tax Act.
These cuts brought the top marginal income tax bracket from 70% to 50% and the lowest from 14% to 11%. Logically, you may be asking yourself how this policy affected the economic state of the United States.
GDP growth, quite possibly the most important economic variable, was a mixed bag after the tax cuts were implemented.
After a nearly 2% drop in 1982, GDP grew nicely for the next several years, including an impressive 4.5% growth rate in 1983. This was following a time of economic struggle in the U.S, and many tout these tax cuts as what brought solid growth back to the U.S economy.
It is important to note that GDP averages about 2-3 percent in the United States and are affected by too many variables to point to one policy as the sole reason for its movement year to year.
Tax revenue in the United States substantially increased following the tax cuts, just as the curve predicted. In 1980, U.S. tax revenue was $517 billion; in 1982, it reached $618 billion; and by 1988, it got a whopping $909 billion. Figures came from the Congressional Budget Office. "Historical Budget Data." Accessed June 9, 2022.
While these figures and metrics do not tell the entirety of the impact of the tax cuts of 1981, they do illustrate the validity of Laffer's theory. It is important to note that the curve represents a point of diminishing returns and that cutting taxes does not always increase tax revenue.
Since the tax cuts of 1981, the curve has been touted by classical or Austrian economists defending their limited government views. Moreover, fiscally conservative lawmakers still cite this example when debating tax changes and reforms.
Criticisms of the Laffer Curve
As with almost everything in economics, the curve is a debated concept.
Proponents of the theory point to the economic success during the post-1980s tax cuts and the above figures. However, some essential counterarguments hold some weight.
1. The increase in tax revenue cannot be explained wholly by the Laffer curve; things like inflation, GDP growth, and other factors contribute as well.
This is an important point. Many factors can influence a country's tax revenue year by year, and due diligence would be needed to pinpoint the effect of the tax cuts.
For example, technological innovation or other economic drivers could lead to higher than typical growth over the years, thus increasing the pool of government taxable money and increasing tax revenue.
2. The labor supply elasticity is the main pretext for the effects of changing tax rates and should be closely examined while debating tax cuts.
Again, it is essential to note that the sensitivity of individuals to changing their behavior based on tax rates can vary greatly depending on the situation. This means that the curve cannot be consistent across all applicable scenarios.
What is considered a high tax rate in one country may be regarded as usual in another. For example, a tax rate of 60% would affect the decisions of American wage earners much more than in the Nordic countries.
3. For this curve to work, tax cuts must lead to more jobs or production.
While it logically makes sense that with less money to be set aside for taxes, businesses and individuals will hire more and be more motivated to work hard, this is not explicitly evident.
There are too many factors at play to isolate the effects of tax cuts on job creation and hours of labor worked. Thus, some large, while logical, assumptions are made with this theory.
The curve is a theory with valuable insight and a proven track record of being accurate in certain instances. However, this is not a "one size fits all" policy and should be examined more in-depth when debating changing tax rates.

Researched and authored by Charlie Fair | LinkedIn
Free Resources
To continue learning and advancing your career, check out these additional helpful WSO resources:

or Want to Sign up with your social account?